The 2026 restaurant marketing playbook

33 Restaurant Marketing Strategies for 2026, Ranked by What Guests Actually Do

Across our restaurant network, 83.5 percent of guests visit once and never come back. The 16.5 percent who return generate 51.4 percent of all visits. That ratio, computed this month from millions of guest profiles across 1,000+ locations, is why this guide to how to market a restaurant is built around bringing guests back, not just finding new ones. Five pillars, 33 strategies, five findings you will not read anywhere else.

By William Wilson, CEO, Bloom Intelligence First published Updated
The short answer

Restaurant marketing in 2026 means capturing every guest’s data automatically, bringing first-time guests back before they lapse, answering every review, and judging campaigns by verified visits and revenue. Across the Bloom network, 16.5 percent of guests produce 51.4 percent of visits.

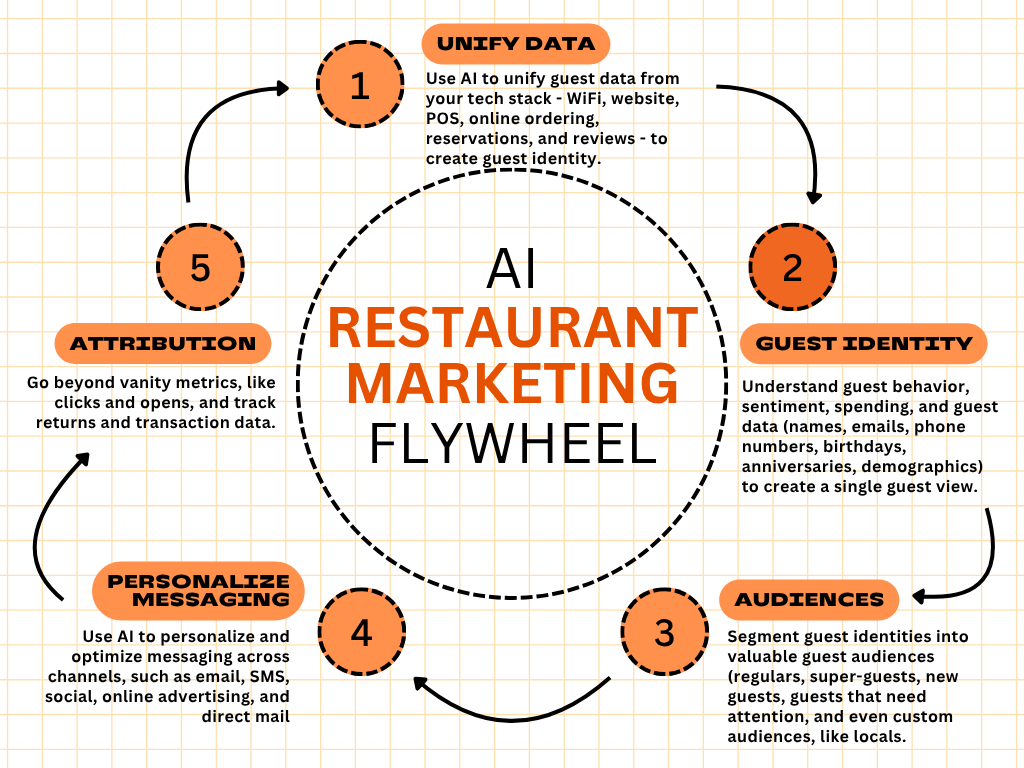
The restaurant marketing flywheel: guest data, automation, reputation and discovery reinforcing each other
83.5%
of guests visit once and never return
92.4%
of new guest profiles captured without a form
38.1%
of reviews get a reply from the restaurant
38%
of at-risk guests recovered by automated win-back
Start here

How to market a restaurant in 2026: start with five numbers

Most restaurant marketing advice is a list of tactics with no evidence attached. This page is different in one way: every claim about guest behavior below was computed from Bloom Intelligence platform data in September 2026, across guests, orders and reviews from 1,000+ restaurant locations. The five findings are marked. The 33 strategies are organized into the five pillars that the findings point to.

Pillar one

Strategies 1 to 6: restaurant discoverability in AI search, Google and voice

Guests ask ChatGPT, Google AI Mode, Perplexity and Siri where to eat. Those engines pull from the same ranking systems as classic search, and they cite pages with substance. Discoverability work happens on your website, your listings and your reviews, not in your ad budget.

Strategy / 01

Put the direct answer where AI engines read it

Google says its AI Overviews and AI Mode are rooted in its core Search ranking systems. There is no special AI markup to add. Answer the question your page targets in 30 to 45 plain words within the first 300 words, on a page you own, with evidence nobody else has. Our restaurant SEO, AEO and voice guide walks through the page pattern.

Cited by Google AI Overviews, ChatGPT, Perplexity and Gemini
Strategy / 02

Write the way guests ask

Voice and AI queries are questions: is there parking, do you take walk-ins on Friday, is the patio dog friendly. Put those questions and one-sentence answers on your location pages in the words a guest would use. Assistants read the page that already contains the sentence they need.

Read aloud by Siri, Alexa and Google Assistant
Strategy / 03

Use only the structured data Google still shows

Restaurant, LocalBusiness, Menu and opening hours markup earn rich results. Review and AggregateRating markup is allowed only on pages that display the reviews being summarized, under Google’s review snippet policy. FAQPage and HowTo were removed from Google Search in 2026. Markup that does nothing is a maintenance cost.

Rich results with zero policy risk
Strategy / 04

Win local search and Google Maps

Identical name, address and phone on every directory. One page per location with hours, menu, photos and the reviews your guests actually wrote. The local pack rewards completeness and consistency, and a location page with substance is the page AI engines quote when someone asks for a recommendation nearby.

Higher Maps placement and more direction requests
Strategy / 05

Complete and refresh your Google Business Profile

Fill every field: attributes, services, menu, dish photos, Q and A. Post weekly. Answer the questions guests leave. Then push the same verified details to Apple Business Connect, Yelp, TripAdvisor and Bing so every listing agrees. Google Business Profile is free and it is the front door most guests use.

More profile views, calls and reservations
Strategy / 06

Make your website the verified source

AI engines recommend restaurants with substance: a real menu, real hours, real guest reviews and consistent sentiment. Roka Akor earned top AI search placement in its category in three markets by making its site the authoritative source, backed by verified guest data from its restaurant customer data platform. Read the Roka Akor case study.

Authority a bigger ad budget cannot buy
Pillar two

Strategies 7 to 13: guest data, segmentation and the second visit

Most restaurants market to every guest the same way. The data says the guests are not the same. Two findings below show where the visits come from and how the profiles get captured in the first place.

Across our restaurant network. Finding 01

The one-visit cliff: 83.5 percent of guests visit once and never return.

Guest profiles captured Jan 2023 to Feb 2026. Computed Sept 17, 2026

The 16.5 percent who return generate 51.4 percent of all visits. The 1.5 percent with ten or more visits generate 24.7 percent.

This is the whole restaurant marketing problem in two numbers. Most marketing budgets chase the first visit. The visits, and the revenue, live in the second visit and beyond. A guest who reaches ten visits averages 28 visits in the window. A one-visit guest averages one.

Visited once
83.5% of guests, 48.6% of visits
2 to 9 visits
15.0% of guests, 26.7% of visits
10 or more visits
1.5% of guests, 24.7% of visits
Worked example

What the one-visit cliff means for a 10,000-guest location

Apply the network shares to a location with 10,000 captured guest profiles. About 8,350 visited once. About 1,500 came back at least once and produced roughly half of every visit the location has ever recorded. About 150 crossed ten visits and produced a quarter of them. If cadence breaks for 200 of those 1,500 returning guests, a win-back sequence recovering the network’s 38 percent brings back 76 regulars. Compare that to the cost of finding 76 new guests, then getting even 16.5 percent of those to return.

Across our restaurant network. Finding 02

Where guest profiles come from: 92.4 percent are captured passively.

New guest profiles, Jan 2025 to Aug 2026, contact imports excluded. Computed Sept 17, 2026

WiFi login creates 68.9 percent of new guest profiles. Online ordering adds 15.1 percent, reservations 7.4 percent, in-store POS 1.0 percent. Website sign-up forms, the only channel that asks the guest to volunteer, produce 7.6 percent.

If your guest database grows only when someone fills in a form, you are working with a twelfth of the guests who actually walked in. The channels that capture automatically do the heavy lifting, and they run without a marketer touching them.

Guest WiFi login
68.9%
Online ordering
15.1%
Website forms
7.6%
Reservations
7.4%
In-store POS
1.0%
Strategy / 07

Unify guest data in a restaurant CDP

One profile per guest across WiFi, POS, reservations, online ordering, reviews and surveys. A CRM stores contacts. A restaurant CDP knows who visited, what they ordered, how often they come and what they said. Every other strategy on this page runs better on unified data, and several are impossible without it.

One view of every guest
Strategy / 08

Capture guests automatically

Finding 02: 92.4 percent of new guest profiles on our network arrive through channels the guest never fills in, led by guest WiFi at 68.9 percent. Online ordering, reservations and POS add the rest. A sign-up form on the counter reaches the one guest in twelve who volunteers.

Automatic capture at scale
Strategy / 09

Segment by recency, frequency, spend and sentiment

Recency, frequency and spend, layered with what the guest said in reviews and surveys. Behavioral segments (new, regular, super guest, cooling off, at risk) update themselves from actual visits, not from a list someone built in March.

Segments that never go stale
Strategy / 10

Aim your budget at the 16.5 percent

Finding 01: the guests who return are 16.5 percent of profiles and 51.4 percent of visits. Treat them differently. Recognize them at the door, message them less often and more personally, and protect them first when frequency slips. The other 83.5 percent get one job: the second visit.

Marketing spent where the visits are
Strategy / 11

Detect lapsing guests before they are gone

A guest who used to come every two weeks and has not been in for five is telling you something. Score every guest on visit cadence and act when the cadence breaks. Automated win-back campaigns recover 38 percent of at-risk guests across our network.

38 percent at-risk recovery
Strategy / 12

Calculate lifetime value by segment

Lifetime value is not average ticket times visits. It is projected revenue across the relationship, adjusted for the risk that the relationship ends. Know the number per segment and the budget conversation changes: a super guest is worth a phone call, a one-visit guest is worth one well-timed email. Retention math here.

Spend matched to guest value
Strategy / 13

Market to the second visit, not the first

Every guest in the 83.5 percent already cost you an acquisition dollar. A welcome message within 48 hours, a second-visit nudge inside three weeks, and a reason to come back on a slow night. Our first-time guest return data shows how narrow that window is.

The highest-return dollar in restaurant marketing
Pillar three

Strategies 14 to 20: restaurant marketing automation that branches on behavior

A calendar blast sends the same message on the same day whatever the guest did. A conditional workflow asks a question at every step (did they open, did they come back, did they spend) and routes each guest down a different path. It is the difference between a mailing and a relationship, and it is the mechanism behind the 38 percent recovery figure on this page.

Defined: conditional workflows

Workflows that ask a question and route on the answer

A conditional workflow is an automation where every step branches on guest behavior. Opened or not. Clicked or not. Returned or not. The same workflow produces a different journey for every guest, and a goal step at the end counts only the guests who actually came back and spent.

That goal step is what makes a recovery rate a verified number rather than an estimate.

38%
Average at-risk guest recovery, verified at the goal step
1
Trigger firesGuest’s visit cadence breaks
2
Win-back email sentWritten in the words your guests use
3
Branch on openOpened: wait three days. Not opened: text message
4
Branch on clickClicked: one-time offer. Not clicked: second email
5
Branch on return visitReturned: thank you and exit. Still gone: manager outreach
6
Goal stepReturn visit and check tied to the campaign
Strategy / 14

Replace manual lists with conditional workflows

Stop exporting lists. Define a trigger (guest enters the at-risk segment) and the branches (opened, did not open, returned, did not return). The workflow decides who qualifies in real time and the list maintains itself.

Hours back every week
Strategy / 15

Run behavior-triggered email

Welcome on the first WiFi login. Birthday on the day. Anniversary of the first visit. Win-back when cadence breaks. Our restaurant email benchmarks show triggered messages return far more recipients than calendar blasts, because the timing comes from the guest, not from the marketer.

Relevant every time, automatic every time
Strategy / 16

Reserve SMS for moments that deserve it

Text messages get read fast, and unsubscribed fast when overused. Keep restaurant SMS for a table opening tonight, an offer that expires today, or a recovery message to a guest who left unhappy. Let the workflow control frequency so no guest gets two texts in a week.

A channel that stays open
Strategy / 17

Catch cooling guests before they are at risk

“Cooling off” sits between regular and at risk: frequency has slowed, the relationship is intact. A light touch here, a note from the manager or a favorite dish back on special, costs a fraction of a full win-back sequence later.

Recovered while it is still cheap
Strategy / 18

Automate birthdays, anniversaries and VIP recognition

Birthday messages are the most reliable single-message performers in restaurant email. The anniversary of a guest’s first visit is the one most restaurants never send. Recognition for a guest crossing into your top tier should arrive the week it happens. Set them once and they run.

The messages guests actually open
Strategy / 19

Run paid ads from first-party audiences, and verify them against orders

Build Meta and Google audiences from your own guest segments: lapsed guests to win back, lookalikes of super guests, active regulars suppressed. Then judge the campaign on completed orders and reservations, not clicks. That is how the Agentic Ad Manager works, and our restaurant advertising playbook covers the setup.

Ad spend judged on closed checks
Strategy / 20

Build loyalty without an app

Finding 02 again: guest WiFi creates 68.9 percent of new profiles. It also recognizes a returning device automatically, so rewards can trigger by email or text without anyone downloading anything. A captive portal is the loyalty program most of your guests will actually join.

Loyalty for guests who never install apps
Pillar four

Strategies 21 to 27: restaurant reputation management and the Voice of the Guest

Your review feed is the highest-resolution record of what happens in your dining room, written by the people paying for it. Three findings below on where the words are, how much the platform you watch distorts the picture, and how rarely anyone answers.

Across our restaurant network. Finding 03

Your worst reviews carry the most words: 89.5 percent of 1-star reviews include a written comment.

Reviews posted Jan 2025 to Aug 2026, six platforms. Computed Sept 17, 2026

66.6 percent of 5-star reviews include a comment longer than a few words. For 1-star reviews it is 89.5 percent, and 84.4 percent for 2-star.

The operational detail (which dish, which shift, which server, how long the wait) is concentrated in the reviews most operators want to look away from. Read them as data, not as insults. 1 and 2 star reviews are 6.8 percent of the total, and they name the problem more often than the other 93.2 percent name the praise.

5 stars
66.6%
4 stars
54.9%
3 stars
69.2%
2 stars
84.4%
1 star
89.5%
Inside the platform

What the words look like once they are clustered, scored and tied to the guest

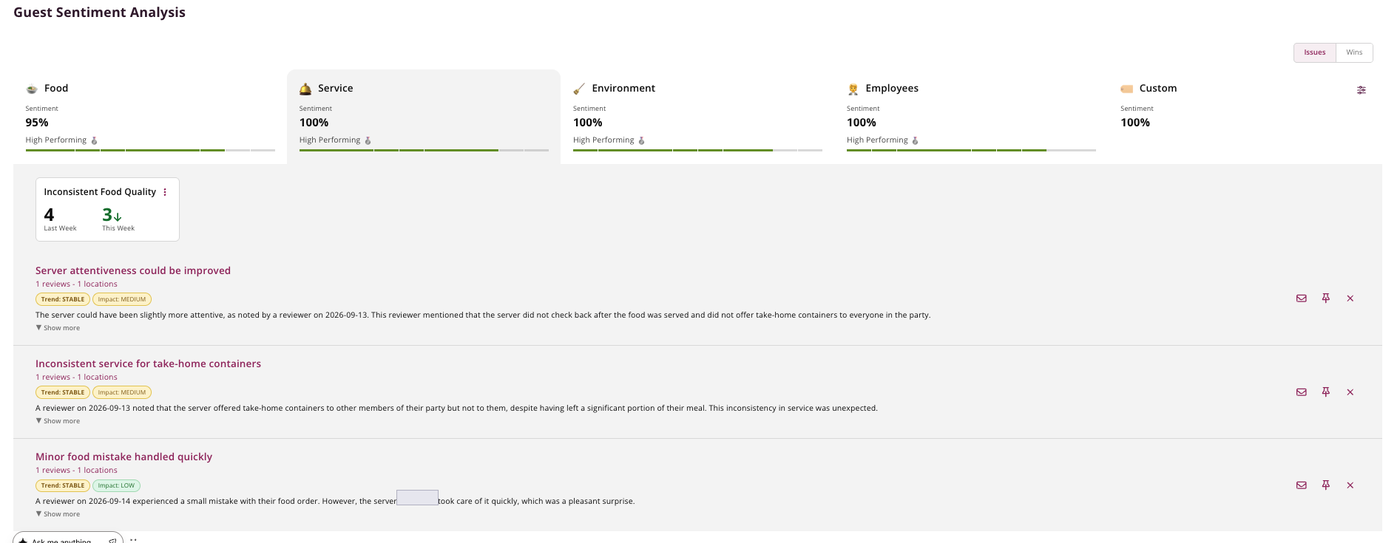
Finding 03 says the detail is in the low reviews. On its own that is a reading problem: nobody has time to read every comment across six platforms. The view below groups every comment into food, service, environment and staff, scores each theme, tracks it week over week, and tags it with an impact level. The theme card at the left shows inconsistent food quality falling from four mentions to three. That is the sentiment signal.

On its own it is still only one signal. The same guest record carries the check from the POS and the visit history from WiFi and reservations, so a rising complaint theme can be read against order volume for the item and against the value of the guests complaining. A theme raised by three first-time guests is a note. The same theme raised by regulars whose frequency has already slipped is a revenue problem with a number attached. Strategies 25 and 26 are how you work it.

Bloom Intelligence Guest Sentiment Analysis view: sentiment scores for food, service, environment, employees and custom themes, a recurring issue card tracking mentions week over week, and three clustered review themes each tagged with a trend and an impact level.
Guest Sentiment Analysis in the Bloom platform. Dashboard capture, September 17, 2026. Staff name removed, no client or location identified.
  1. Signal 1SentimentReview and survey text clusters into a named theme with a trend and an impact level.
  2. Signal 2TransactionsPOS data says whether order volume for the flagged item or daypart is moving with it.
  3. Signal 3BehaviorVisit history says whether the guests raising it are first-timers or regulars who are slipping.
  4. ActionOne decisionA kitchen or shift fix for the cause, and a recovery message to the named guests at risk.
Across our restaurant network. Finding 04

The platform rating gap: the same restaurants score 4.80 on Tock and 4.25 on Yelp.

Reviews posted Jan 2025 to Aug 2026, by platform. Computed Sept 17, 2026

Tock 4.80, OpenTable 4.63, Google 4.56, TripAdvisor 4.31, Yelp 4.25. A 0.55 star spread describing the same kitchens.

1 and 2 star reviews are 13.4 percent of Yelp reviews, 7.4 percent of Google reviews and 3.4 percent of OpenTable reviews. Benchmark your reputation on one platform and you inherit that platform’s bias. Only a unified view across every platform shows your real sentiment baseline.

Tock
4.80
OpenTable
4.63
Google
4.56
TripAdvisor
4.31
Yelp
4.25
Across our restaurant network. Finding 05

Six in ten 1 and 2 star reviews never get a reply from the restaurant.

Reviews posted Jan 2025 to Aug 2026, six platforms. Computed Sept 17, 2026

38.1 percent of all reviews received a reply from the restaurant. For 1 and 2 star reviews it was 39.3 percent. 78.1 percent of all reviews were 5 stars.

The reply rate barely moves with the rating. Restaurants are not triaging their worst reviews, they are answering about four in ten of everything. A public reply is the one marketing message every future guest reads before they choose you. Check your own reply share against 39.3 percent this week.

All reviews replied
38.1%
1 and 2 star replied
39.3%
5 star share of all reviews
78.1%
1 and 2 star share of all reviews
6.8%
Strategy / 21

Read every platform in one place

Finding 04: the same restaurants average 4.80 on Tock and 4.25 on Yelp. Watching one platform gives you one platform’s bias. Unified reputation management puts Google, Yelp, OpenTable, TripAdvisor, Facebook and Tock in one inbox and shows the real baseline.

One inbox, one honest number
Strategy / 22

Reply to every review in your own voice

Finding 05: 38.1 percent of reviews get a restaurant reply. Guests reading reviews see the silence too. A reply that names the dish and the server, in the language your guests use, is a marketing message aimed at your next guest. AI drafts it in your voice; you approve it or let it publish.

Reply share you can measure weekly
Strategy / 23

Ask before they post

A short survey within 24 hours of the visit reaches the guest before any public review exists. A low score routes to a manager and a private recovery message. A high score routes to a one-tap review link. Every response is tagged with the guest’s segment, so you know whether the unhappy guest was a regular.

Bad experiences handled in private
Strategy / 24

Respond to negative reviews with a system, not a mood

Acknowledge the specific complaint, do not argue, move the conversation to a private channel, then log the issue against the location and the shift. How to respond to negative restaurant reviews is a repeatable process, and the log is what turns Finding 03 into operations.

Recover the guest and fix the cause
Strategy / 25

Turn review text into operational alerts

Finding 03: 89.5 percent of 1-star reviews carry a written comment. Cluster them by topic and location. Twelve mentions of “wait” at one location this month, at lunch, while lunch checks are down, is an alert for the general manager, not a task for the marketer. Sentiment analysis does the clustering.

Problems seen before they reach the P and L
Strategy / 26

Measure guest satisfaction by segment, not on average

A single NPS hides the story. Split every survey metric by guest tier and you learn whether your regulars or your first-timers are the unhappy ones, which changes the fix entirely. Guest identity plus sentiment is where the useful decisions live.

A score that tells you what to do
Strategy / 27

Hold your rating floor

Across our network, 78.1 percent of reviews are 5 stars and 6.8 percent are 1 or 2 stars (Finding 05). Track your own two shares monthly. A 5-star share below 78.1 percent with an unchanged kitchen is a review-capture problem. A rising low-star share is an operations problem. They need different fixes.

Two numbers that govern reputation
Pillar five

Strategies 28 to 33: restaurant marketing attribution you can defend

Opens and clicks are vanity. The metric that matters is guests who came back and what they spent, traced from the message to the return visit to the check. Every strategy in this pillar exists to make that trace possible and then act on it.

Defined: closed-loop attribution

From the send to the check, verified at every step

Closed-loop attribution follows a campaign from the send, to the guest’s return (confirmed by a WiFi login or reservation), to the POS transaction, to the items on the check. Every dollar attributed is observed, not modeled.

It is the difference between a marketing tool that reports opens and a platform that proves revenue. It is also why our client retention is 99.3 percent.

$53K+
Average verified revenue recovered per location per year
1
Campaign sentEmail, text or paid ad fires from the workflow
2
Guest opens or clicksRecorded on the guest profile, not in aggregate
3
Guest returnsWiFi login or reservation confirms the visit
4
Check recordedPOS integration records the ticket and items
5
Revenue attributedTied to the campaign that caused it
6
Next campaign learnsThe loop turns with better data
Strategy / 28

Wire attribution in on day one

Attribution bolted on at quarter end is guesswork. Connect WiFi, POS and messaging to the same guest profile before the first campaign sends, so every return visit and every check can be tied to the message that caused it. Restaurant marketing attribution, explained.

Verified ROI from the first send
Strategy / 29

Report returns and revenue, not opens

Every campaign has four numbers: sends, opens, guests who returned and revenue those guests spent. The first two are interesting. The second two are decision-grade. Optimize against returns and revenue and most of your email debates end.

Decision-grade campaign data
Strategy / 30

Benchmark against the network, not against last month

Use the numbers on this page: 83.5 percent one-visit share, 78.1 percent 5-star share, 6.8 percent low-star share, 38.1 percent review reply share, 38 percent at-risk recovery, and a network average ticket of $38.73 (orders March to August 2026). More restaurant benchmarks here.

Know where you stand before you spend
Strategy / 31

Calculate ROI per location

A group average hides the location that is printing money and the one that needs help. Report campaign returns and revenue per location, monthly. Intervene where the number is wrong and leave the rest alone. Full-stack attribution covers the per-location build.

Interventions where they matter
Strategy / 32

Separate real loyalty from rented loyalty

A repeat visit driven by a discount is rented. Real loyalty is a frequency lift that holds after the offer stops. Compare visit cadence for guests who redeemed against guests who returned without an offer, and optimize for the second group.

Frequency that outlasts the coupon
Strategy / 33

Run the loop on a cadence

Review attribution weekly. Tune workflows monthly. Audit sentiment and rating shares quarterly. Re-run your own version of Findings 01 to 05 twice a year. The restaurants that compound are the ones with a calendar. Our blog carries the next round of plays as the data moves.

Advantage that compounds
Ideas by situation

Restaurant marketing ideas for small budgets, new openings and multi-location groups

Marketing for restaurants with one marketer and no budget

Do four things and let them run: automatic guest capture at the door, a welcome sequence, a win-back sequence, and a reply to every review by Friday. Then complete your Google Business Profile. That is strategies 8, 13, 17 and 22, and none of them costs media dollars. The coffee shop marketing guide is the small-operator version of this page.

Marketing a new restaurant

Your opening month is the largest cohort of first-time guests you will ever have, and Finding 01 says 83.5 percent of them will not come back on their own. Capture every one of them from the first night, send the welcome within 48 hours, and schedule the second-visit nudge before you spend a dollar on awareness.

Marketing a multi-location group

Report every metric on this page per location, not as a group average. Finding 04 applies inside your own group too: two locations with the same kitchen standards can carry very different review profiles depending on which platform their guests use. The fine dining marketing and fast casual marketing guides cover segment-specific plays, and the brewery and taproom guide covers the tasting-room model.

Questions

Questions restaurant operators ask about marketing

Ten questions from search data and sales calls, each answered in a few sentences with the network figure where one exists.

Bring the first-time guest back. Across our network 83.5 percent of guests visit once and never return, so a welcome message and a second-visit nudge inside three weeks beat any acquisition tactic. Capture the guest first, through guest WiFi, online ordering and reservations, then automate the follow-up.
Capture every opening-week guest into a profile from day one, through WiFi, POS, reservations and online ordering, and send a welcome message within 48 hours. New restaurants fail at retention more than acquisition. Build the guest database before you spend on ads, and complete your Google Business Profile before you open.
Spend on the guests you already have. Set up automatic guest capture, a welcome sequence, a win-back sequence and weekly review replies. All four run on their own once built. Then claim your Google Business Profile fully. Our coffee shop marketing guide shows the small-operator version of this playbook.
Mostly automatically. On our network 68.9 percent of new guest profiles come from guest WiFi login, 15.1 percent from online ordering and 7.4 percent from reservations. Website forms add 7.6 percent. How social WiFi collects guest data explains the mechanics.
Grouping guests by what they do: how recently they visited, how often, how much they spend and what they say in reviews and surveys. Segments such as new, regular, super guest, cooling off and at risk update from behavior. Read how segments become campaigns.
Reaching guests who already visited, ordered or logged into your WiFi with a timed message by email, text or paid ads. It works because the guest already knows you. Our restaurant remarketing guide covers timing and offers.
Reply within a day, name the specific problem, do not argue, and offer a private way to make it right. Then record the complaint against the location and shift. Across our network only 39.3 percent of 1 and 2 star reviews get any reply. The full process is here.
Post the food, the people and the room, then use paid social for the part organic cannot do: reach your own lapsed guests and lookalikes of your best guests. Judge the spend on completed orders and reservations, not likes. Our advertising playbook has the audience setup.
Track each campaign from send to return visit to check. Report guests who returned and revenue they spent, per campaign and per location, instead of opens and clicks. That requires WiFi, POS and messaging tied to one guest profile. Restaurant marketing attribution explains the setup.
Being the source AI engines cite, automatic guest data capture over sign-up forms, campaigns that branch on guest behavior, reputation managed across every platform at once, and paid advertising verified against completed orders. Each one shows up in the strategies above with the network data behind it.
See your own numbers

Run Findings 01 to 05 on your restaurants

In a 30-minute session we will pull your one-visit share, your capture mix, your review reply share and your platform rating gap, then show which of the 33 strategies moves them first. No pitch deck.

About the author

William Wilson, CEO, Captiveyes Group and Bloom Intelligence

Will leads Bloom Intelligence, the restaurant marketing platform built on a guest data platform that unifies WiFi, POS, online ordering, reservations, reviews and surveys for 1,000+ restaurant locations. He writes about what the network data says restaurant guests actually do, and what operators can do about it on Monday.

Data note. Figures marked “across our restaurant network” are computed from Bloom Intelligence platform data as of September 2026: guest profiles captured January 2023 to February 2026 (Finding 01), new guest profiles January 2025 to August 2026 (Finding 02), reviews posted January 2025 to August 2026 across six platforms (Findings 03 to 05), and orders March to August 2026 (average ticket). Percentages are published at full precision. Underlying counts are not published. The 38 percent at-risk recovery, $53K+ per location, 99.3 percent retention, 72 NPS, 4.9 Google and 4.6 G2 figures are Bloom’s published platform results.

How this was made. Research and analysis for this article were produced with Bloom Intelligence’s data platform and AI tools, then reviewed and edited by William Wilson.

Sources