

Restaurant Customer Retention in 2026: Only 18.84% of New Guests Make a Second Visit. Win That One First.
How do restaurants improve customer retention? Win the second visit. On the Bloom network only 18.84% of new guests came back a second time. Of those who did, 47.23% made a third visit, and each visit after that, through the sixth, was more likely than the one before.
Most restaurant retention advice treats every guest the same: send more offers, run a loyalty program, ask for reviews. Our data says retention is not one problem. It is a ladder, and almost all of the loss happens on the first rung.
We followed every new guest first seen on the Bloom Intelligence network from October to December 2025 and counted how far each one climbed. Only 18.84% made a second visit. But of the guests who made a second visit, 47.23% made a third, and of those, 63.05% made a fourth.
Read those three numbers together and the strategy writes itself. The hardest visit to earn is the second one. Every visit after it, through the sixth, is more likely than the one before, so the money and attention a restaurant spends on retention should start on day one, not after a guest is already a regular.
Where restaurant guests are lost
Most restaurant guests are lost after one visit. Across the Bloom network, 78.12% of guests visited a location only once in the 12 months to September 2026. That single number hides where the loss happens, and the ladder below shows it.
That 78.12% comes from our 2026 restaurant benchmarks. Our state of restaurant guest retention report measured it a different way, by year, and found restaurants kept only about 21% of their guests from one year to the next. For rate benchmarks, start there.
Both numbers say the same thing. A restaurant that only watches its overall retention rate sees one big, discouraging figure. A restaurant that watches the ladder sees exactly where guests drop off, and which message would catch them.
The retention ladder: why the second visit is the wall
The retention ladder is the share of guests who climb from each visit to the next. On the Bloom network 18.84% of new guests reached a second visit. From there the odds rose at every step: 47.23%, 63.05%, 70.61% and 75.85%.
The first bar is the whole story. Four out of five new guests never climb the first rung. A guest who does climb it is already 2.5 times more likely to take the next step than a brand new guest was to take the first one.
The pattern is not a one-quarter accident. We ran the same ladder for guests first seen a year earlier, who have had almost two years to come back.
| Step | First seen Q4 2024 | First seen Q4 2025 |
|---|---|---|
| Visit 1 to 2 | 19.85% | 18.84% |
| Visit 2 to 3 | 51.90% | 47.23% |
| Visit 3 to 4 | 67.25% | 63.05% |
| Visit 4 to 5 | 73.37% | 70.61% |
| Visit 5 to 6 | 79.47% | 75.85% |
Two things stand out. First, a whole extra year to return barely lifted the first rung: 19.85% for the older group against 18.84%. Time alone does not bring guests back. Second, the upper rungs were higher in the older group, and its regulars carried it. Guests who reached five visits were 5.08% of that group but made 42.61% of its visits.
What the ladder means for guest lifetime value and churn
Lifetime value is the ladder in dollars. In the group first seen in late 2024, guests who reached five visits were 5.08% of new guests but made 42.61% of the group’s visits. Every guest you lift one rung moves toward that small group that carries the room.
Churn works the same way in reverse. Most churn is a guest who never made visit two, and it is silent. The churn that hurts most is a regular who stops, because that guest was on the top rungs. Our post on predictive guest scoring covers how to spot that guest early.
Why is the second visit so important for restaurant retention?
Because it is where most guests are lost. Only 18.84% of new guests on the Bloom network made a second visit, but 47.23% of those made a third and 63.05% of third-visit guests made a fourth.
The second visit has a clock
Most second visits happen early or not at all. On the Bloom network, 42.3% of guests who returned exactly once did so within 30 days of their first visit, 57.6% within 60 days and 69.0% within 90 days.
Those figures come from our 2026 restaurant benchmarks. The lesson is that a welcome message sent in week six is late. The first 30 days decide most second visits.
How the guest first arrived matters too. In our study of first-time guests, about 13% of WiFi walk-ins came back, against about 20% of guests whose first visit was an online order. A walk-in gives you a thinner signal, so it needs a faster follow-up.
The 5-step restaurant customer retention plan
The best way to increase restaurant customer retention is to work the ladder in order: capture every first visit, measure the climb, welcome new guests inside 30 days, push the third visit, and win back regulars who fade.
1. Capture every first visit into a guest profile. You cannot welcome a guest you cannot name. WiFi login, online ordering, reservations and the POS each see a different slice of your guests. Our guest WiFi data playbook covers the walk-ins that most systems miss.
2. Measure your ladder, not just your average. Count the share of new guests who reach visit two, then three, then four. The section below shows how to do it from a POS export.
3. Welcome every new guest inside 30 days. In our 2026 email marketing benchmarks, a new-guest welcome email brought back 7.2% of recipients, against 0.27% for a one-time blast. That is the cheapest second visit you will ever buy.
4. Push the third visit. The rung from two to three is the second-largest drop. A post-visit thank-you returned 29.9% of recipients in the same benchmarks, and a visit-milestone email returned 19.8%. Send them to guests who just made visit two.
5. Win back regulars before they are gone. A regular who stops coming rarely complains. They just stop. Bloom’s win-back workflows recover an average of 38% of at-risk guests.
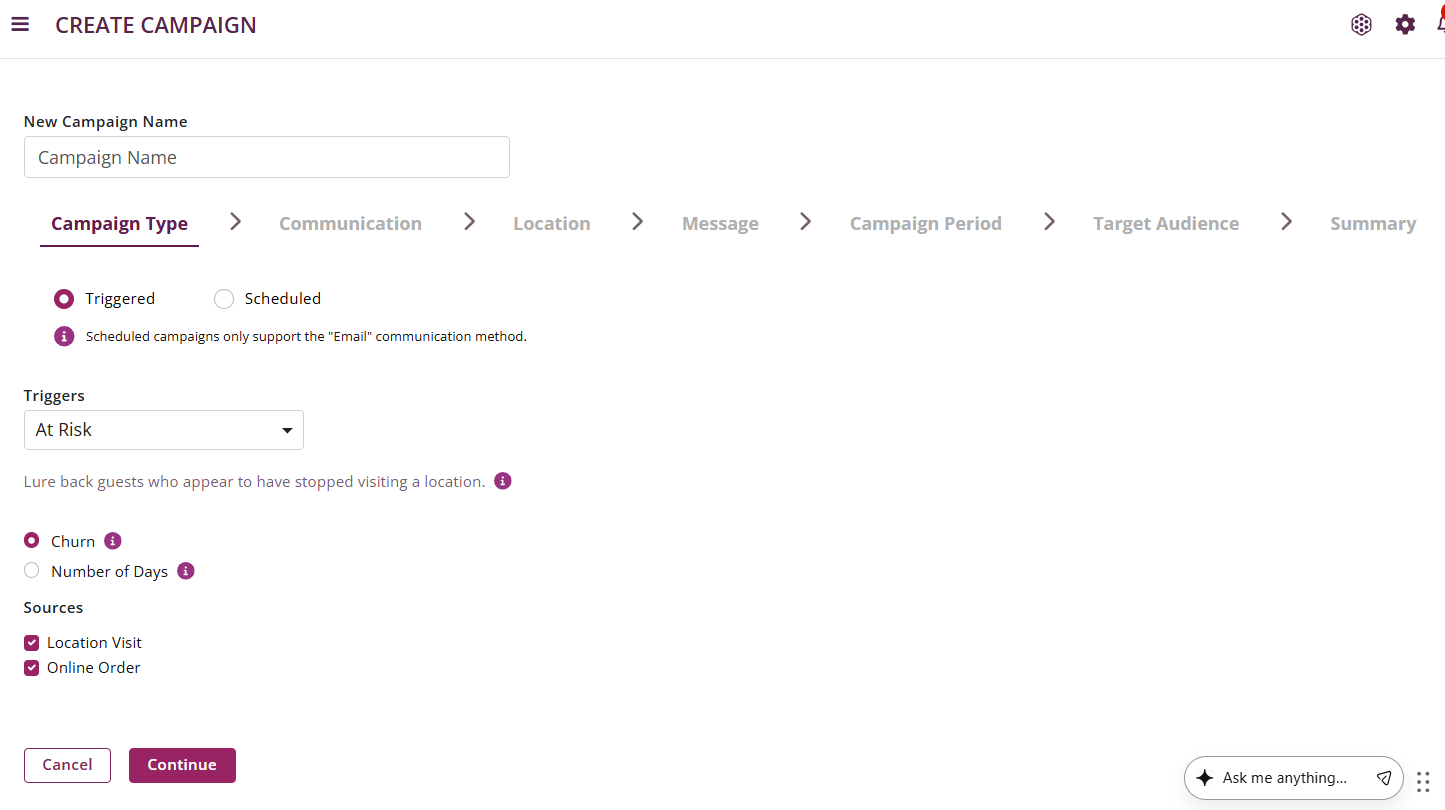
In Bloom, a Triggered campaign with the At Risk trigger runs on its own to “Lure back guests who appear to have stopped visiting a location.” You choose whether it fires on Churn or a Number of Days, and it counts both Location Visit and Online Order as sources, so a regular who switches to delivery is not mistaken for a lost one.
What share of your new guests reach a second visit?
See your own retention ladder and a live At Risk win-back set up on your locations, with return visits counted for each message.
How to measure your restaurant’s retention ladder on Monday
Export every guest first seen in one quarter with their visit count. Divide the guests with two or more visits by all guests, then three or more by two or more, and so on. Compare each step with the network figures.
Here is the network ladder applied to 1,000 new guests. It is the benchmark to hold your own export against.
| Of 1,000 new guests | Guests | Step rate |
|---|---|---|
| Made a second visit | 188 | 18.84% |
| Made a third visit | 89 | 47.23% |
| Made a fourth visit | 56 | 63.05% |
| Made a fifth visit | 40 | 70.61% |
- Pick one quarter at least nine months back, so guests have had time to return.
- Count visits per guest per location from your POS, online ordering and reservation exports.
- Compute each step. Guests with two or more visits divided by all guests, then three or more divided by two or more.
- Find your weakest rung. If visit one to two is under 18.84%, fix your welcome first. If visit two to three is under 47.23%, add a thank-you or milestone message.
- Ask your vendors one question: what share of my new guests made a second visit last quarter? If they cannot answer, they cannot improve it.
This October to December matters more than most quarters. The guests you see for the first time over the holidays are next year’s regulars or next year’s strangers, and the ladder above says the first 30 days decide which.
In a 30-minute demo we pull your retention ladder from your own guest data, show you which rung loses the most guests, and set up the welcome and At Risk messages that target it.
For the money side of the same question, read how much a restaurant should spend on marketing. For building segments on top of the ladder, see restaurant guest segmentation in 2026.
Methodology
Ladder figures use Bloom visit patterns across all sources (WiFi, POS, online ordering and reservations), counted per guest per location, so a guest who visits two locations is counted at each. The 2025 group is every guest whose first visit fell between October 1 and December 31, 2025. The 2024 group is the same quarter one year earlier. Visits for both were counted through October 8, 2026. The 2025 group’s second-visit share rises slightly as late returns arrive: our budget analysis measured 18.71% for the same group on October 1, 2026. The 1,000-guest table applies the network step rates and rounds to whole guests. Timing figures, the 78.12% one-visit share and channel return rates come from the Bloom posts linked above. Email return rates come from Bloom’s published 2026 email benchmarks. The 38% at-risk recovery rate is Bloom’s published platform average.
Figures marked “across our restaurant network” are computed from Bloom Intelligence platform data as of October 2026. They reflect the Bloom network and may not be the same for every restaurant. Research and analysis for this article were produced with Bloom Intelligence’s data platform and AI tools, then reviewed and edited by William Wilson.

By William Wilson, Founder and CEO, Bloom Intelligence. William has built restaurant guest marketing since founding Captiveyes Group in 2006.
Enjoying this? Get more Bloom Intelligence in your Google results.
FREQUENTLY ASKED QUESTIONS
Common Questions About Restaurant Customer Retention
Start with your second-visit rate, because that is where most guests are lost. On the Bloom network, 18.84% of new guests made a second visit. If more than 18.84% of your new guests come back a second time, you are ahead of the network. Measured by year, Bloom's state of restaurant guest retention report found restaurants kept only about 21% of their guests from one year to the next.
About four out of five. Only 18.84% of new guests first seen on the Bloom network from October to December 2025 made a second visit. Across the network, 78.12% of guests visited a location only once in the 12 months to September 2026.
Because the second visit is the hardest one to earn, and every visit after it gets easier. On the Bloom network, 18.84% of new guests made a second visit. Of those, 47.23% made a third, 63.05% of third-visit guests made a fourth, and 75.85% of fifth-visit guests made a sixth.
Within 30 days. Of guests on the Bloom network who returned exactly once, 42.3% came back within 30 days of their first visit, 57.6% within 60 days and 69.0% within 90 days. A welcome message sent in week six is already late.
Emails triggered by what a guest just did. In Bloom's 2026 email marketing benchmarks, a new-guest welcome email brought back 7.2% of recipients, a post-visit thank-you brought back 29.9% and a visit-milestone email brought back 19.8%. A one-time blast brought back 0.27%.
Pick one quarter at least nine months back and export every guest first seen in it, with their visit count per location. Divide guests with two or more visits by all guests, then guests with three or more by guests with two or more, and so on. Compare each step with the network: 18.84% for visit one to two and 47.23% for visit two to three. Your weakest step is where to start.
Catch them before they are gone. A regular who stops coming rarely complains, so the signal is a change in visit pattern. In Bloom, a Triggered campaign with the At Risk trigger messages these guests automatically, counting both location visits and online orders. Bloom's win-back workflows recover an average of 38% of at-risk guests.
Ready to Turn Your Guest Data Into Revenue?
Join 1,000+ restaurant locations using Bloom Intelligence to recover lost guests, automate marketing, and drive measurable revenue growth.
Keep Reading
View All Posts →Win-Back Campaigns: How Restaurants Bring Lapsed Guests Back
Key TakeawayA restaurant win-back campaign is an automated message sent to a guest whose visits have slowed, with a reason...
Should Restaurants Respond to Every Review? What 90,471 Reviews Show
Key TakeawayShould restaurants respond to every review? Yes, positive and negative. Across 90,471 reviews at Bloom network restaurants, restaurants replied...
How Much Should a Restaurant Spend on Marketing in 2026? The 3 to 6% Rule, and What a New Guest Is Actually Worth
Key TakeawayHow much should a restaurant spend on marketing? Most restaurants spend 3% to 6% of revenue, the benchmark Toast...