

Restaurant Sentiment Analysis: Guests Warn You Two Months Before Revenue Drops. Here Is What They Say First.
Two months before a restaurant’s revenue dipped, its guests had already said why. Across the Bloom Intelligence network, when a location’s share of 1 and 2 star reviews doubled against its own baseline, POS revenue two months later ran a median 7.0 percent below the same month at peer locations. Normal months ran 0.8 percent above. The warning was sitting in the review feed the whole time.
01. What guests actually complain about
Most reputation advice starts with how to word a reply. This starts one step earlier, with what guests are saying in the first place. We classified every written review on the Bloom Intelligence network from January 2025 through August 2026 by the topics it mentions, then compared the 1 and 2 star reviews against the 4 and 5 star ones.
One thing to notice before the chart: unhappy guests write. 88.1 percent of 1 and 2 star reviews carry a written comment. Only 66.5 percent of 4 and 5 star reviews do. The guests you most need to hear from are the ones who leave you the most to read.
Service is the largest complaint by a wide margin. More than one in four low star reviews describe waiting, being ignored, or a server who never came back. Food quality is second, and it has the sharpest contrast: a 1 or 2 star review is 16 times more likely to call food cold, undercooked or bland than a 4 or 5 star review is. Staff attitude is the same story at 14 times.
Price is different. It shows up in 17.5 percent of low star reviews, but also in 3.8 percent of high star ones, so the lift is only 4.6 times. Guests mention price when they are happy too. A price complaint on its own is rarely the reason a guest turned on you. A price complaint next to a service complaint usually is: the same check feels expensive when the food took an hour.
Noise and portion size barely separate the bands at all. Guests who loved the night mention how packed the room was almost as often as guests who hated it. If you are staffing a response program, those two topics deserve acknowledgment, not alarm.
02. What the happy ones praise
The 4 and 5 star reviews tell you what to protect. 38.2 percent praise the food specifically. 22.6 percent praise friendly or attentive staff. And 10.7 percent name a server or bartender by first name.
That last number matters more than it looks. Roughly one in nine happy guests took the trouble to type a team member’s name into a public review. Those reviews are recruiting material, retention material for the person named, and a public record of who your guests notice by name. If your reply program does not forward every named review to the person named, on the day it lands, you are leaving the cheapest morale program in hospitality unused.
03. How fast restaurants reply, and to whom
Across all rated reviews on the network, 38.1 percent received a reply from the restaurant. That figure covers a wide range of operators, from groups that answer everything within the hour to locations that have never replied once, so treat it as the network average, not a target.
The finding that should change a Monday morning is this: 1 and 2 star reviews were answered at almost exactly the same rate as 4 and 5 star reviews, 39.4 percent against 38.2 percent. Restaurants are not prioritizing the reviews that carry risk. They are replying in the order the reviews arrive, or not at all.
Among the low star reviews that were answered, 36.1 percent got a reply within an hour and 70.5 percent within a day. The median was 7.5 hours. Speed, where it exists, is already good. Coverage is the gap. Six in ten unhappy guests on the network hear nothing back, and every future guest who reads that review sees the silence too.
1 and 2 star reviews are 6.8 percent of everything posted. At the median location on the network that is about two a month. Answering all of them, quickly, is not a staffing problem. It is a routing problem.
04. The two month warning: sentiment, visits, sales
Individual reviews are anecdotes. A change in the mix is a signal. To test whether the mix predicts anything, we built a month by month panel for every location with at least 15 months of both review data and WiFi visit data, and a smaller panel of locations that also have POS transactions connected. Then we looked for review spikes and watched what happened next.
A spike is defined tightly. A location’s share of 1 and 2 star reviews over a rolling three months had to be at least double its own prior six month baseline, at least four points higher, and include at least three low star reviews. That rules out one bad week at a quiet location. By that definition, 8.8 percent of location months were spikes, and 53.6 percent of locations had at least one in the twenty month window. This is not rare. Roughly one location in two lived through one.
Three things happen around a spike.
Before it, the location was busy. In the month a spike began, POS revenue at those locations had just risen a median 5.4 percent, against 2.2 percent in normal months, and order counts rose 6.1 percent against 2.4. The complaints did not arrive out of nowhere. They arrived after a month the kitchen and the floor were stretched. This is the single most useful thing in the data: the leading indicator of a review spike is a good month.
Two months after it, visits dip. Counting unique devices on guest WiFi, and adjusting for the calendar month across the network, spike locations ran a median 3.9 percent below the seasonal norm two months later. Normal months ran 1.0 percent above it. 34.4 percent of spike months were followed by a visit drop of 10 percent or more, against 28.4 percent of normal months.
Two months after it, revenue dips harder. On the POS panel, revenue two months out ran a median 7.0 percent below the seasonal norm, against 0.8 percent above for normal months. 38.1 percent of spike months were followed by a revenue drop of 10 percent or more, against 21.9 percent of normal months. A location that just spiked was 1.7 times as likely to lose a tenth of its revenue by the second month.
05. Correlation, causation, and what an operator should do with it
Be careful with this. Across the whole network, the month to month correlation between a change in low star share and the change in visits two months later is small, around minus 0.08. A statistician would call that weak and they would be right. Most months at most locations, reviews wobble and nothing happens.
The effect lives in the tail. It is when the mix breaks its own pattern, doubling against baseline, that the following months separate from normal. Both the visit dip and the revenue dip cleared conventional significance tests, and both survive when the biggest single months are trimmed out. But we cannot say from this data that the bad reviews caused the dip. The likelier story is that all three signals are measuring the same underlying thing: a stretch of weeks where the operation fell behind demand, guests noticed, some of them said so publicly, and some of them quietly came back less.
That distinction changes what you do. If reviews caused the dip, the fix would be reply faster and bury them. Because reviews are a symptom, the fix is upstream: treat the review spike as the earliest visible reading of an operational problem, find the shift and the topic, and correct it before the visit data confirms what the reviews already told you. The reply still matters, because future guests read it. It is just not the fix.
06. Check your own numbers in 15 minutes
- Pull every review from the last 90 days across Google, Yelp, Facebook and Tripadvisor for one location. Count them, then count the 1 and 2 star ones. Divide. That is your current low star share.
- Do the same for the six months before that. That is your baseline. The median location on the network runs about 8.2 percent.
- If the last 90 days is double your baseline and at least four points higher, you are in a spike by the definition above. Expect visits and revenue to be soft two months from now unless something changes.
- Read the low star reviews from the spike window and sort them by topic: service, food, staff attitude, seating, price. The topic that dominates tells you which manager to call first.
- Count how many of those low star reviews have a reply. The network answers 39.4 percent. If yours is below that, fix routing before you fix wording.
- Check the month before the spike began against your POS. If sales were up, the spike is a capacity problem, not a quality problem, and the fix is staffing and pacing on the shifts that spiked.
One location, one afternoon, a spreadsheet. If you run more than a handful of locations, this is exactly the work the next section automates.
07. How Bloom watches all three signals at once
The analysis above took a data team a day. Inside Bloom it is a screen. Three layers do the work.
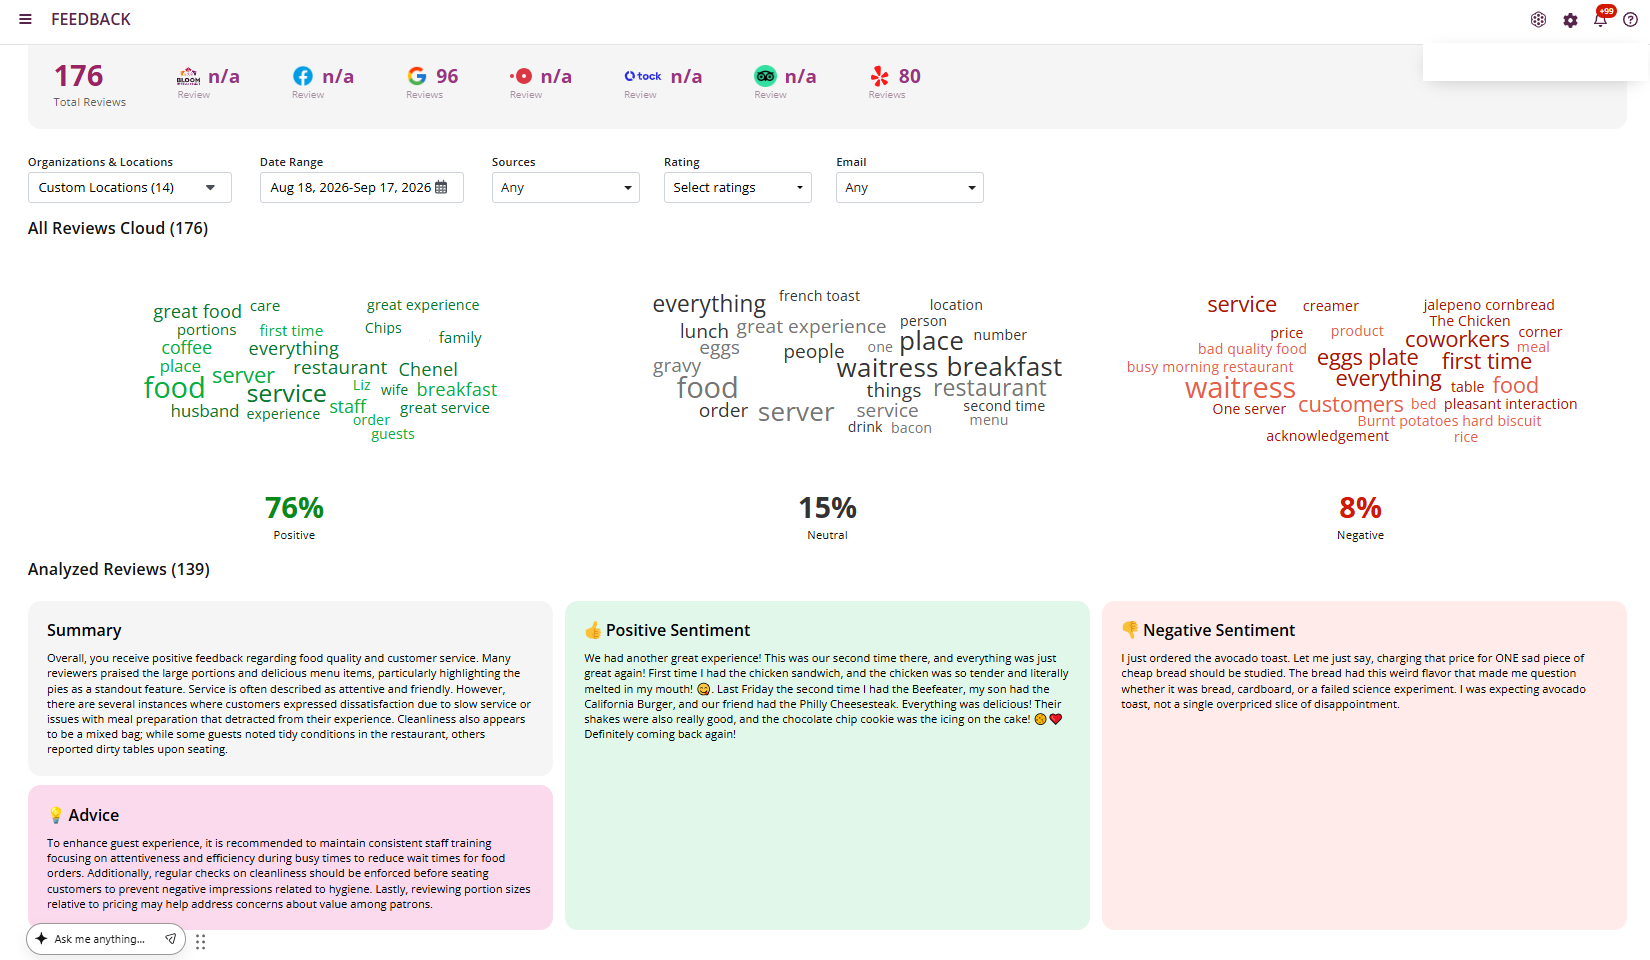
The Voice of the Guest layer harvests every place a guest speaks: public reviews on Google, Yelp, Facebook and Tripadvisor, multi step surveys, comment cards and website form widgets. AI groups what they say into food, service, environment and staff, tags each theme with a trend and an impact level, and drafts a reply in the brand’s voice within minutes.
The behavior layer counts every guest who walks in, not only the ones who order online or book. Guest WiFi sees the visit frequency of regulars, so the dip that shows up in figure 5 appears as a rising At-Risk segment weeks before it shows up in sales.
The transaction layer ties POS revenue and order counts to the same locations and, where a guest is identified, to the same profiles. That is what turns “complaints are up” into “complaints are up, regulars are slipping, and revenue at that location is already following.”
When the three move together, the system does not send a report. It fires: an operational alert to the location, a recovery campaign to the regulars who have gone quiet, and a reply to the guest who spoke. Across the network, campaigns of that kind recover 38 percent of at-risk guests. The point of finding the signal two months early is that two months is enough time for that recovery to run before the P&L closes.
08. Operator questions
What is restaurant sentiment analysis?
Reading every review, survey and comment card as one data set and tracking how the mix of topics and star ratings changes over time. The value is in the change, not the individual review. On the Bloom network, a doubling of low star share preceded a 7.0 percent median revenue dip two months later.
What do restaurant guests complain about most?
Slow or absent service, in 27.6 percent of 1 and 2 star reviews on the Bloom network, followed by food quality at 23.4 percent and price or value at 17.5 percent. Food quality and staff attitude show the sharpest contrast with happy reviews, at roughly 15 times the mention rate.
How fast should a restaurant respond to a negative review?
Within 24 hours, and the same day where possible. Among low star reviews that get answered on the Bloom network, 70.5 percent are answered within a day and the median is 7.5 hours. Speed is rarely the problem. Six in ten low star reviews get no reply at all, and coverage is the gap to close first.
How do you respond to a negative restaurant review?
Name the specific issue the guest raised, own it without excuses, say what changed, and invite them back through a named person. Keep it short and human. Future guests read the reply more than the review. Never argue, never template, and never let a 1 star review sit unanswered while 5 star ones get thanked.
What is Voice of the Guest?
Everything guests tell you, gathered from every channel where they speak and structured so it can be measured: public reviews, surveys, comment cards and website forms. Voice of the Guest becomes useful when it is tracked by location, topic and time, and compared with visit and sales data from the same weeks.
How many bad reviews is a warning sign?
It depends on your own baseline, not a fixed number. The rule the data supports: when your 1 and 2 star share over three months is at least double your prior six months and at least four points higher, treat it as a spike. About 53.6 percent of locations on the Bloom network hit that threshold at least once in twenty months.
Do bad reviews actually cost revenue?
They travel with it. Locations that spiked saw revenue run a median 7.0 percent below normal two months later and were 1.7 times as likely to lose 10 percent or more. The data shows correlation, not cause. The most likely explanation is that reviews, visits and sales all reflect the same operational strain, with reviews showing it first.
Which reviews should you answer first?
1 and 2 star reviews, then 4 and 5 star reviews that name a team member. The network currently answers both at about the same rate, 39.4 percent and 38.2 percent, which means risk is not being prioritized. Route low star reviews to a manager the same day and forward named praise to the person named.
09. Methodology and data note
Figures marked “across our restaurant network” or “on the Bloom network” are computed from Bloom Intelligence platform data as of September 2026, covering reviews posted January 1, 2025 through August 31, 2026. These figures are data from the Bloom network and may not be the same for all restaurants. Topic classification uses text patterns in English and is approximate; a review can carry more than one topic. Star bands are 1 to 2, 3, and 4 to 5. Reply figures count the first reply from the restaurant recorded on the platform. The spike analysis uses locations with at least 15 months of both review and guest WiFi data, and a smaller set with POS transactions connected; outcomes are medians of month over month change after subtracting the network’s change for the same calendar month, so seasonality is removed. Both the visit and revenue results were tested with a rank test and by trimming the largest 10 percent of months in each direction, and held. Absolute counts are withheld by policy. Ratios are published at full precision.
Research and analysis for this article were produced with Bloom Intelligence’s data platform and AI tools, then reviewed and edited by Allen Graves.
Enjoying this? Get more Bloom Intelligence in your Google results.
FREQUENTLY ASKED QUESTIONS
Common Questions About Restaurant Marketing
Reading every review, survey and comment card as one data set and tracking how the mix of topics and star ratings changes over time. The value is in the change, not the individual review. On the Bloom network, a doubling of low star share preceded a 7.0 percent median revenue dip two months later.
Slow or absent service, in 27.6 percent of 1 and 2 star reviews on the Bloom network, followed by food quality at 23.4 percent and price or value at 17.5 percent. Food quality and staff attitude show the sharpest contrast with happy reviews, at roughly 15 times the mention rate.
Within 24 hours, and the same day where possible. Among low star reviews that get answered on the Bloom network, 70.5 percent are answered within a day and the median is 7.5 hours. Speed is rarely the problem. Six in ten low star reviews get no reply at all, and coverage is the gap to close first.
It depends on your own baseline, not a fixed number. The rule the data supports: when your 1 and 2 star share over three months is at least double your prior six months and at least four points higher, treat it as a spike. About 53.6 percent of locations on the Bloom network hit that threshold at least once in twenty months.
They travel with it. Locations that spiked saw revenue run a median 7.0 percent below normal two months later and were 1.7 times as likely to lose 10 percent or more. The data shows correlation, not cause. The most likely explanation is that reviews, visits and sales all reflect the same operational strain, with reviews showing it first.
Ready to Turn Your Guest Data Into Revenue?
Join 1,000+ restaurant locations using Bloom Intelligence to recover lost guests, automate marketing, and drive measurable revenue growth.
Keep Reading
View All Posts →Restaurant Email Marketing Benchmarks 2026: The Emails That Actually Bring Guests Back
Restaurants send 99.7% of their email as blasts. Blasts return 0.27% of recipients. Welcome and win-back emails return 6.5% to...
Restaurant Guest Segmentation in 2026: From Five Buckets to Infinite Segments
Legacy RFM segments are the map, but modern restaurant segmentation is combinatorial: layer menu affinity, interaction events, and location onto...
Restaurant Advertising in 2026: The Google and Meta Playbook That Ties Every Click to a Closed Check
Key TakeawayRestaurant advertising works in 2026 when campaigns are built from your own guest data and measured against closed checks...